The project
Glaucoma is a degenerative eye disease and one of the leading causes of irreversible blindness worldwide. Screening relies on the optic nerve head, and in particular on the cup-to-disc ratio (CDR), which compares the size of the optic cup with the optic disc. A larger CDR points to a loss of nerve tissue. Judging it by eye is subjective and varies between observers.
This project automates that measurement. A MATLAB program takes a retinal fundus image, finds the disc and the cup, calculates the CDR and grades the risk. It uses classical image processing instead of machine learning, so every number can be traced back to something visible in the image. It was a two-person lab project in Image Systems Engineering at RMIT, and it is an academic prototype, not a medical diagnostic tool.
My part
I wrote the primary code and designed the method. In the report I wrote the classical methods part of the literature review, the methodology, the future work and the conclusion. My teammate wrote the supplementary code and the results analysis, and we tested and debugged the segmentation together.
How it works
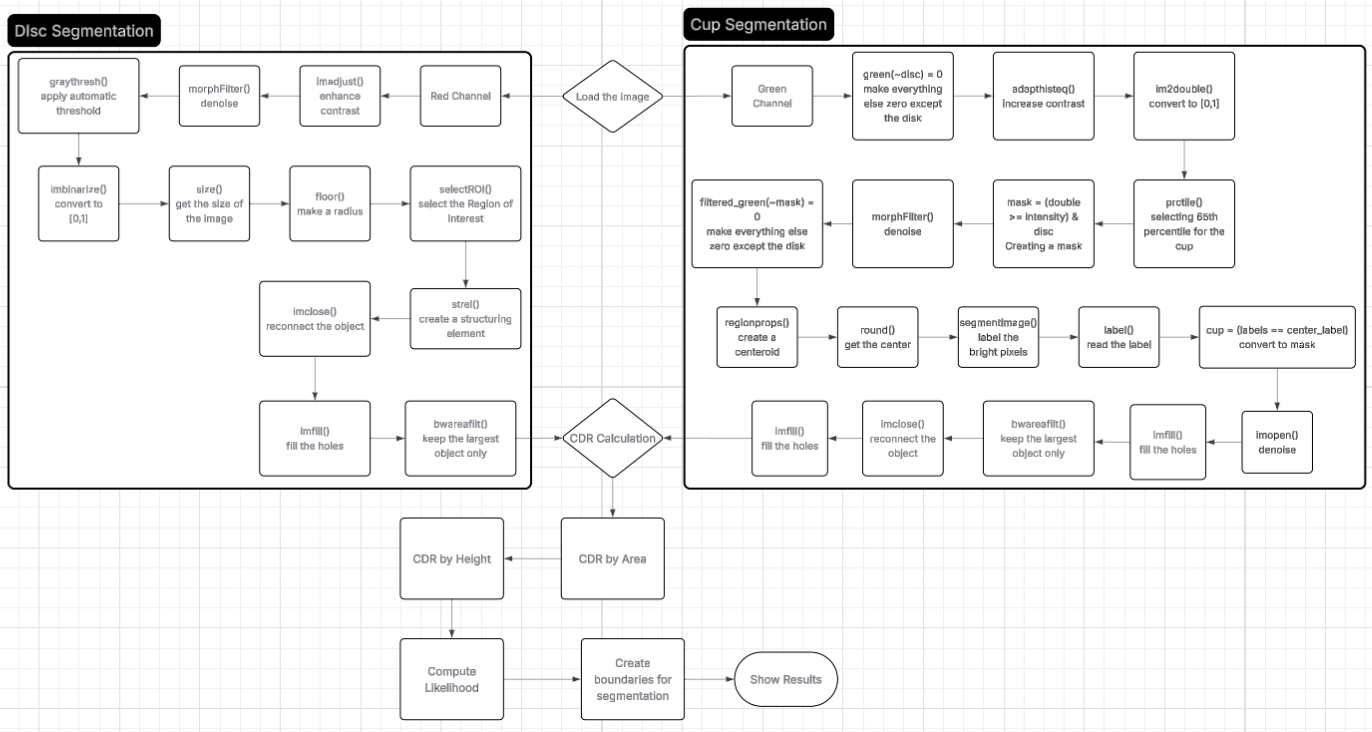
Each fundus image is split into colour channels. The red channel shows the optic disc best and the green channel shows the cup best, so each is segmented on its own channel.
For the disc, the contrast is raised and the noise filtered out, then Otsu thresholding separates the disc from the background. A circular region of interest is applied, and morphological closing and hole filling clear up gaps. Only the largest connected region is kept, which gives a clean disc mask.
For the cup, everything outside the disc is set to zero. Adaptive histogram equalisation then makes the bright central region stand out, and a mask keeps the pixels above the 65th percentile of brightness inside the disc. Noise is filtered out, the bright region at the disc centre is selected, and the same clean-up steps tidy the shape. The filtering and segmentation functions come from earlier labs in the course.
The CDR is calculated two ways, by area and by vertical height, and the program reports the higher of the two. That makes it less likely to understate the risk. The CDR is then mapped to a glaucoma likelihood and a risk level: below 0.5 is Low, 0.5 to 0.6 is Moderate, and above 0.6 is High.
Results
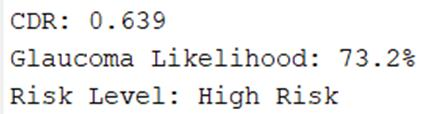
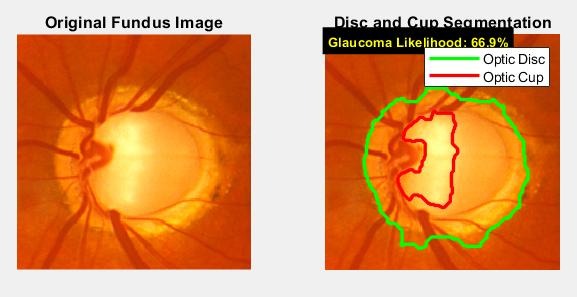
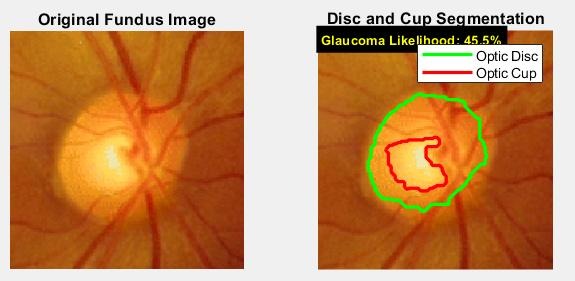
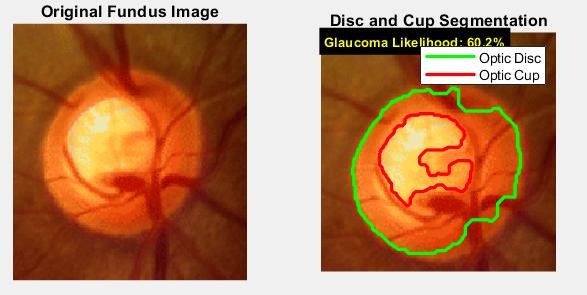
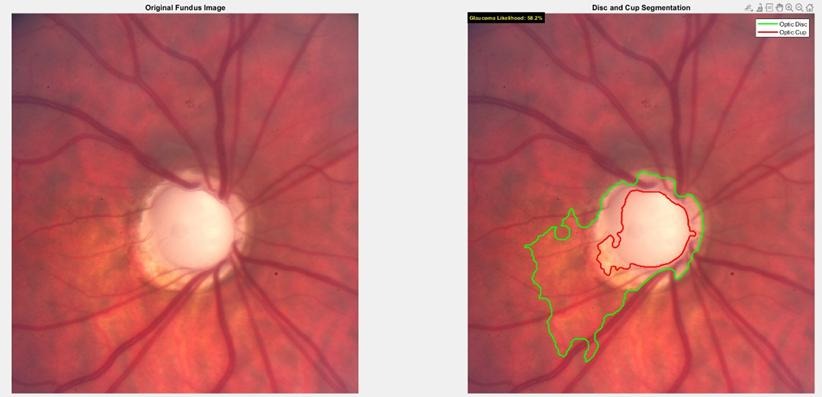
The program was run on five fundus images. Each produces two pictures, the isolated disc and cup, and the original image with the boundaries drawn on it, together with the numbers in the MATLAB command window. The overlay shows the disc in green and the cup in red.
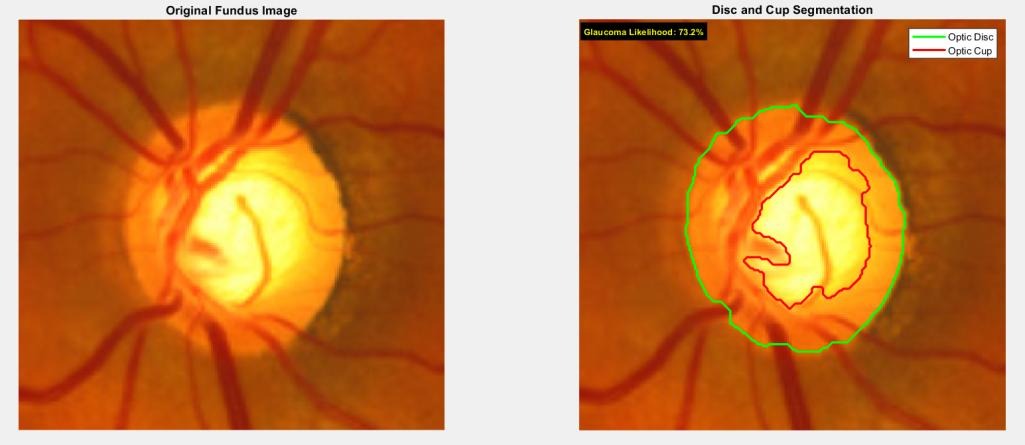
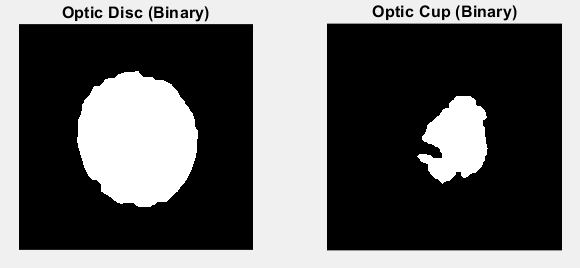
The other four images, with the overlay and the risk level for each:
| Image | CDR | Likelihood | Risk level |
|---|---|---|---|
| 1 | 0.601 | 66.9% | High |
| 2 | 0.639 | 73.2% | High |
| 3 | 0.473 | 45.5% | Low |
| 4 | 0.561 | 60.2% | Moderate |
| 5 | 0.549 | 58.2% | Moderate |
CDR ranged from 0.47 to 0.64, and the likelihoods from 45% to 73%. The two images above 0.6 were graded High, in line with the clinical rule that a CDR above 0.6 suggests significant cupping. The boundaries matched the visible disc and cup margins in the images, and each image took under ten seconds on a standard workstation.
What I found
- When the cup boundary was flattened or the lighting uneven, the area-based CDR understated the cupping, while the height-based CDR stayed steadier. That is why the program takes the higher value.
- Shadows and reflections can make the brightness threshold overestimate the cup and inflate its area. Image 5 shows this.
- CDR on its own does not capture everything. A cup that is long vertically but not wide gives a high CDR even when the cupping is mild.
- Only five images were tested, so these results show that the method works and are not a measure of clinical accuracy.
Next
- Correct the illumination and suppress the blood vessels before segmenting.
- Add other measures, such as the ISNT rule and cup shape asymmetry, to reduce false positives.
- Reject low-quality images automatically instead of giving an unreliable CDR.
- Compare against other classical and modern methods, and test on a larger dataset.